Quarterly Money Market Commentary
September 30, 2025

First American Money Market Funds
What market conditions had a direct impact on the bond market this quarter?
Economic Activity – U.S. economic growth outperformed expectations in the third quarter of 2025 (Q3), driven by a continued unwind of the trade and inventory dynamics from earlier in the year as well as durable consumption levels and elevated business investment, notably AI-related investments. U.S. Gross Domestic Product (GDP) is projected to grow near 2.0% for Q3. Growth is forecast to slow toward 1.0%-1.5% to close the year amid headwinds from persistent trade policy uncertainty and elevated inflation, but a more accommodative Federal Reserve (Fed) and tax policy incentives should provide support for GDP next year. Consumer spending remained resilient during the quarter, supported by higher income households. This comes despite growing concerns over slower hiring and persistent inflation eroding purchasing power. Employment conditions continued to weaken throughout the quarter with labor demand grinding to a halt as cautious businesses continue to adopt a low-hire/low-fire strategy. The gradual decline in U.S. job openings continued with August openings at 7.2 million positions while the total number of unemployed workers in the labor force as of August was 7.4 million, the highest level since September 2021. At the time of this writing, the September employment data remained delayed due to the government shutdown, but growth in Monthly Nonfarm Payrolls (NFP) slowed sharply throughout Q3 to an average of 29,000 over the prior three months through August and the U3 Unemployment Rate increased to 4.3% in August. Average Hourly Earnings growth slowed to 3.7% year-over-year (YoY), moving closer to pre-pandemic levels. Inflation pressures accelerated in Q3 with the Consumer Price Index (CPI) increasing to 2.9% in August, led by rising goods prices and sticky services costs. Core inflation was also higher with CPI ex. food and energy rising 3.1% YoY for August and the Fed’s preferred inflation index – the PCE Core Deflator Index – increasing 2.9% YoY. While the inflationary impact of tariffs has been more manageable than originally expected, the reacceleration of core inflation and upcoming fiscal stimulus make achieving the Fed’s 2% target unlikely in the near-term.
Monetary Policy – The Fed lowered the federal funds target range by 25 basis points (bps) to 4.0% to 4.25% at its September meeting. The Fed’s post-meeting statement was revised, adding that job gains have slowed and the unemployment rate has edged up but remains low. The statement also reiterated inflation remains “somewhat elevated.” During the post-meeting press conference, Fed Chair Powell characterized the policy action as a “risk management” cut, and highlighted downside risks to employment have risen. Additionally, the Fed maintained the pace of its balance sheet reduction program (quantitative tightening) with a monthly cap on Treasury securities of $5 billion and on agency mortgage-backed securities of $35 billion.
The Federal Open Market Committee (FOMC) released its updated Summary of Economic Projections at the September meeting. The FOMC’s “dot plot” suggests an additional 50 bps in rate cuts by the end of 2025 (target range of 3.50% to 3.75%), although the committee is divided with seven members favoring no additional cuts in 2025 and another two members calling for one 25 bps rate cut. The median dots show further rate cuts of 25 bps in 2026 and 25 bps in 2027, and the estimated longer-run neutral rate was unchanged at 3.0%. The FOMC’s economic projections were revised to show a higher real GDP growth forecast through 2027, a lower projected unemployment rate for 2026-2027, and increased inflation in 2026 compared to the prior release. Interestingly, the FOMC strengthened their economic outlook despite projections for a lower policy rate path.
Fiscal Policy – The third quarter was another period of active fiscal policy as the quarter started with passage of the sweeping One Big Beautiful Bill Act on July 4 and ended with the federal government entering a shutdown. And in between there was a continual flow of tariff-related announcements including enactment of the “Liberation Day” tariffs (initially paused for 90 days) and additional sector-specific actions. While the tariff landscape continues to evolve, including an upcoming hearing at the Supreme Court on the legality of tariffs issued under the International Emergency Power Act, they are here to stay in one form or another given their significance within the Trump administration’s agenda. The One Big Beautiful Bill Act, among other things, permanently extends the 2017 tax cuts, boosts spending for defense, immigration, and border control, and raises the debt limit by $5 trillion. The Act also includes the resumption of bonus depreciation and spending cuts to Medicaid and clean-energy tax credits and subsidies. Passage of the Act should provide a modest boost to economic growth beginning early next year and removes debt ceiling risk for a couple of years.
To close out the quarter, the federal government entered a shutdown on October 1 after Congress failed to pass a funding bill by September 30. At the time of this writing the shutdown continues, with House Republicans having passed a continuing resolution to fund the government at current levels through November 21, but the Senate has yet to come to agreement as Democrats are holding out for a bill that would extend subsidies for Affordable Care Act (ACA) coverage. While we expect the government shutdown to have a limited long-term effect on growth, the Trump administration’s stated desire to layoff rather than furlough a large number of federal workers could pose a greater than normal risk to near-term sentiment. On the municipal front, the sector faces growing financial pressures from increased local funding needs, expiration of federal pandemic aid, and economic uncertainties related to tariffs. Municipalities enter this period from a position of relative strength, however, as solid revenues and robust reserves provide the flexibility needed to navigate these headwinds.
Credit Markets – Equity and bond markets stabilized in the third quarter after a volatile first half of the year. While tariff uncertainty remained elevated, the absence of worst-case trade scenarios and progress in global supply chain adjustments helped calm investor nerves. Investment-grade credit spreads ground tighter, ending the quarter at or near multi-year lows. New issuance surged in the quarter, particularly in September, and was met with robust investor demand for new corporate and asset-backed debt. Secondary market liquidity remained strong and there was no meaningful deterioration in the credit quality of held positions.
Yield Curve Shift
|
U.S. Treasury Curve |
Yield Curve 6/30/2025 |
Yield Curve 9/30/2025 |
Change (bps) |
|---|---|---|---|
|
3 Month |
4.291% |
3.932% |
-35.9 |
|
1 Year |
3.967% |
3.614% |
-35.2
|
|
2 Year |
3.719% |
3.608% |
-11.1 |
|
3 Year |
3.689% |
3.619% |
-7.0 |
|
5 Year |
3.797% |
3.741% |
-5.6 |
|
10 Year |
4.228% |
4.150% |
-7.8 |
Duration Relative Performance
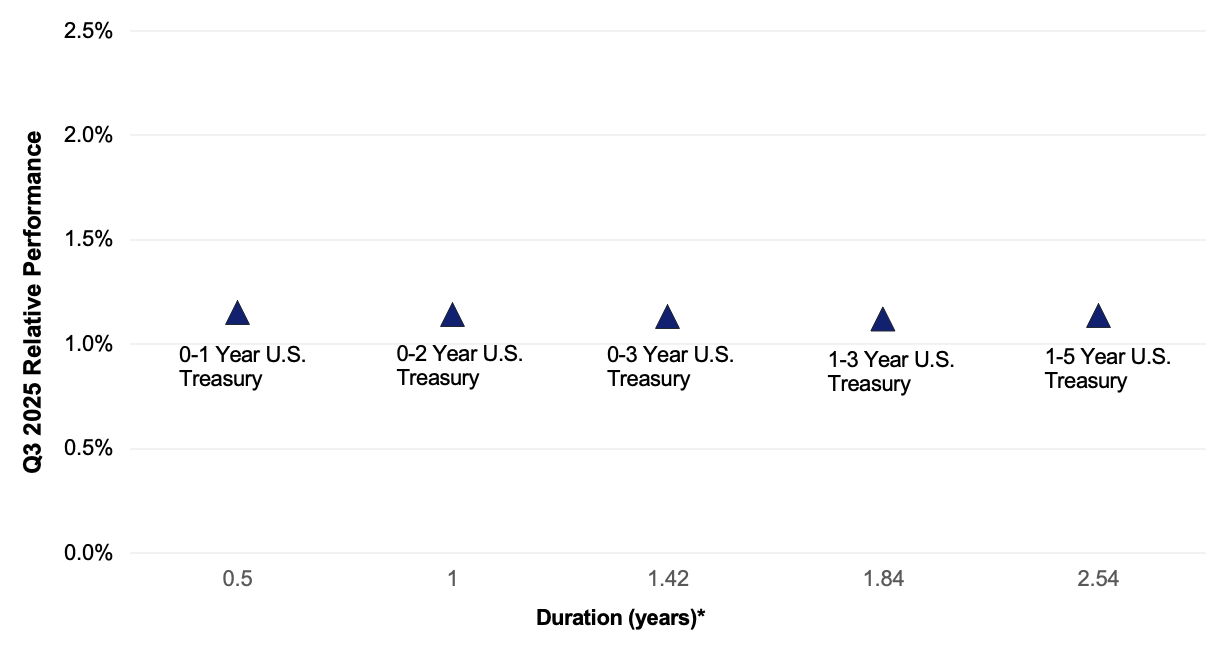
*Duration estimate is as of 9/30/2025
Falling yields contributed to the quarter’s strong fixed income returns. The three-month to 10-year portion remained inverted, with front-end yields remaining stable on no Fed policy changes in the quarter and 10-year yields only rising 2.3 bps. With two to five-year yields falling more than short-term yields, longer duration strategies outperformed short duration strategies. There was some volatility along the front-end of the yield curve, with two-year yields trading within a range of 3.60% and 4.05% in the quarter, presenting some tactical opportunities to position portfolio duration.
Credit Spread Changes
|
ICE BofA Index |
OAS* (bps) 6/30/2025 |
OAS* (bps) 9/30/2025 |
Change (bps) |
|---|---|---|---|
|
1-3 Year U.S. Agency Index |
2 |
1 |
-1 |
|
1-3 Year AAA U.S. Corporate and Yankees |
2 |
5 |
3 |
|
1-3 Year AA U.S. Corporate and Yankees |
23 |
23 |
0 |
|
1-3 Year A U.S. Corporate and Yankees |
47 |
40 |
-7 |
|
1-3 Year BBB U.S. Corporate and Yankees |
72 |
66 |
-6 |
|
0-3 Year AAA U.S. Fixed-Rate ABS |
48 |
41 |
-7 |
Despite already being near multi-year lows, corporate credit spreads tightened further in the quarter on strong investor demand. Credit spreads are being supported by solid corporate fundamentals, favorable technical factors and improving economic optimism.
Credit Sector Relative Performance of ICE BofA Indexes
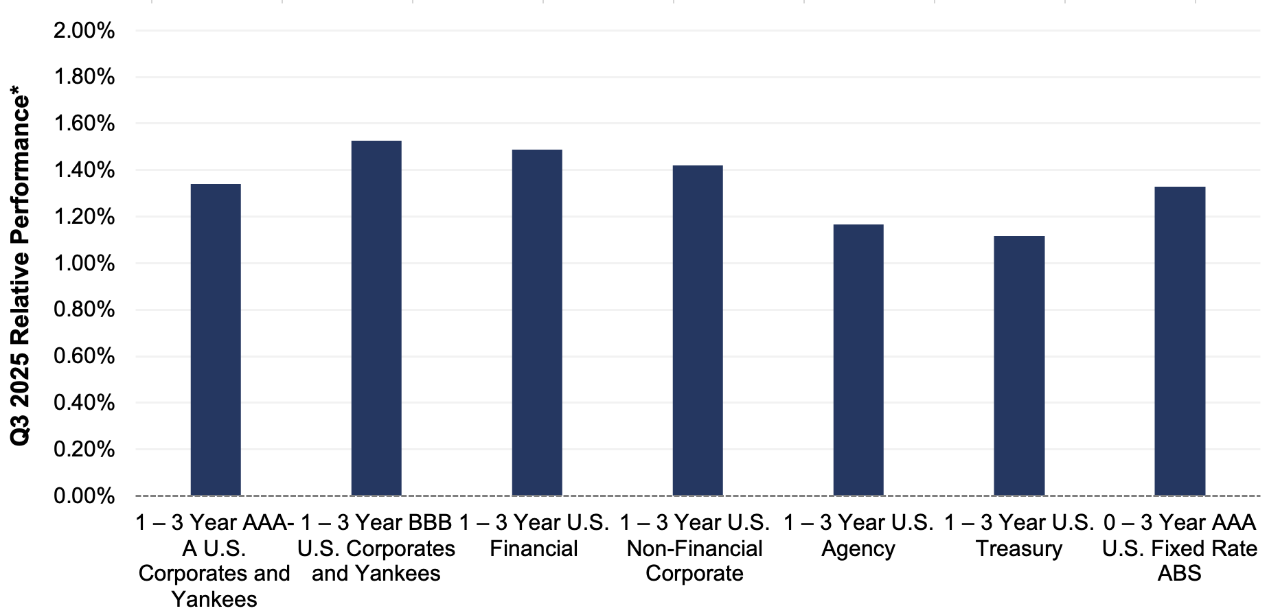
ICE BofA Index
*AAA-A Corporate index outperformed the Treasury index by 23.0 bps.
*AAA-A Corporate index underperformed the BBB Corporate index by 17.8 bps
*U.S. Financials outperformed U.S. Non-Financials by 6.8 bps
Similar to the second quarter, lower Treasury yield curve levels and tighter credit spreads across the investment-grade universe generated strong absolute performance for all fixed income sectors. Down-in-credit outperforming higher-rated credit was a general theme, highlighted by the BBB corporate index’s 17.8 bps outperformance of the AAA-A corporate index.
What were the major factors influencing money market funds this quarter?
The third quarter of 2025 saw the Fed start its easing cycle, reducing rates 25 bps to a range of 4.00-4.25%. While inflation is still above the Fed’s preferred target, the labor market is softening, which is leading markets to price in two more 25 bps cuts by year-end. Though there are varying opinions on the timing and pace of future FOMC actions, it is clear the path forward is lower rates. Moving forward, the challenge for managers will be determining how economic, inflation and employment data influences the pace and timing of the easing cycle.
Industry-wide, money market fund assets trended higher during the quarter, as short-term yields continue to attract investors. We believe money market funds remain a viable option relative to other short-term cash equivalent options.
First American Prime Obligations Funds
Credit conditions and trading ranges have been stable withstanding the current rate and geopolitical and economic environment. Considering the yield curve and a conservative cash flow approach, the First American Funds were positioned with strong portfolio liquidity metrics influenced by fund shareholder makeup. We continued to employ a heightened credit outlook, maintaining positions presenting minimal credit and headline risk to the Fund’s investors. During the third quarter, our main investment objective was to prioritize liquidity while opportunistically enhancing portfolio yield, with a combination of fixed and floating rate securities, reflecting our economic, credit and interest rate outlook. We believe the credit environment and higher relative fund yields make the sector an appropriate short-term option for investors.
First American Government and Treasury Funds
As the Fed began to take a more dovish tone, Government Money Market Funds remained defensive, positioning to preserve yields with the expectation of falling rates. Managers extended durations, investing in longer term securities to get ahead of a forecasted lower yield environment. These market dynamics support a more barbell investment strategy. For money market fund investors, extension into lower yielding long-term securities puts marginal downward pressure on portfolio yields. However, higher Secured Overnight Financing Rate (SOFR)/Repo levels should provide support, muting some of the decline in front-end money market fund yields. Strategically, when presented with appropriate value, managers purchased floating-rate investments anticipated to benefit shareholders over the securities holding period. Investment strategy will be focused on the pace of falling rates in the coming quarters as markets make determinations on the Fed’s comfort level with inflation, unemployment rates, economic growth, and ultimately the timing and pace of future Fed policy action.
First American Retail Tax Free Obligations Fund
Strong reinvestment demand of municipal bond maturities and coupon payments provided ample opportunity for broker/dealers to lower resets on variable rate demand notes (VRDNs). These municipal market conditions are typical of the June to August period and were widely expected. Beyond these seasonal patterns, broader markets also contemplated the path of easing from the Fed. Notably, the September Fed rate cut did not have an immediate impact on VRDN rates. The relative richness of Securities Industry and Financial Markets Association Index (SIFMA) versus SOFR, going into the rate cut, was the primary reason for this lack of reaction. We also suspect that broker-dealers were reluctant to carry inventory into quarter-end and set levels accordingly. Future Fed rate cuts are likely to push SIFMA lower. To minimize the potential impact on the Fund’s overall yield, we are continuously looking to Identify and add attractive fixed-rate municipal securities.
What near-term considerations will affect fund management?
Industry wide, we anticipate that prime fund yields will gradually decline as managers roll maturities into lower yielding securities that are pricing in future rate cuts. However, broadly speaking, front-end yields in credit securities should continue to benefit from the overall supply of Treasury securities and higher SOFR levels. A modest term risk-premium, as well the impacts of a smaller prime money market fund universe should create competition among credit issuers for the marginal dollar and support prime money market fund yields. In the coming quarters, we will capitalize on investment opportunities that make economic sense based on market outlooks and break-even analysis. We believe the Institutional and Retail Prime Obligations Funds will remain reasonable short-term investment options for investors seeking higher yields on cash positions while assuming minimal credit risk.
Yields in the government-sponsored enterprise (GSE) and Treasury space will decline in concert with anticipated and realized Fed rate cuts. As with non-government debt, Government and Treasury Fund yields will continue to gradually decline as managers roll maturities into securities with lower yields pricing in future rate reductions. Managers will defend against future cuts by extending to optimal spots on the curve relative to fed rate forecasts, policy impacts and market volatility. We anticipate some moderate yield dislocations in Treasury, GSE and Repo issues as Treasury supply fluctuates. In general, due to overall debt supply and continued quantitative tightening, we expect SOFR/Repo levels to remain elevated, giving a marginal boost to money market fund-yields. Going forward, we will exploit large supply changes in Treasury issuance that create volatility and yield opportunities on the front end as the forces of supply and demand seek optimization. We will continue to capitalize on current market conditions to seek optimal value in most relevant asset classes.
For more information about the portfolio holdings, please visit
https://www.firstamericanfunds.com/index/FundPerformance/PortfolioHoldings.html
Sources
Bloomberg
https://www.federalreserve.gov/monetarypolicy/files/monetary20250917a1.pdf
https://www.federalreserve.gov/monetarypolicy/files/fomcprojtabl20250917.pdf
https://economics.bmo.com/en/publications/detail/56a75a45-fbc2-49b6-9fd3-0fd5426af907/
https://budgetlab.yale.edu/research/state-us-tariffs-september-26-2025
https://blinks.bloomberg.com/news/stories/T3QF8FGOYMTE

Jim Palmer, CFA

Jeff Plotnik

Mike Welle, CFA