Quarterly Money Market Commentary
March 31, 2026

First American Money Market Funds
What market conditions had a direct impact on the bond market this quarter?
Economic Activity – U.S. economic activity during the first quarter of 2026 (Q1) reflected a stable yet cautious expansion, with moderate growth persisting despite rising geopolitical concerns. U.S. Gross Domestic Product (GDP) growth is projected to be near 2.0-2.5% in Q1, supported by consumer spending and business investment. Growth was further aided by a rebound in government activity following the extended federal government shutdown in the fourth quarter of 2025. Consumer spending ended the quarter on firmer footing after a weak start, with positive momentum leading into the conflict in the Middle East. While aggregate spending remains resilient, it has become increasingly concentrated among high-income households, raising concerns about the sustainability of a two-speed growth trajectory amid the recent surge in energy costs. Employment conditions continue to exhibit monthly volatility, but overall trends imply labor market resilience and stabilization as the low-hire, low-fire environment persists. U.S. job openings fluctuated throughout the quarter but maintained their broader downward trend, with February openings at 6.9 million versus 7.2 million total unemployed workers in March. Monthly Nonfarm Payrolls (NFP) growth averaged 68,000 per month during the quarter, an acceleration compared to the prior quarter, but well below historic levels. Low payroll growth is not inherently bad as low layoff activity and slower labor force growth have helped stabilize the unemployment rate, which the Federal Reserve (Fed) views as a more reliable gauge of labor market health. The U3 Unemployment Rate was 4.3% as of March. Average hourly earnings continued their gradual descent, rising 3.5% year over year in March. Inflation pressures accelerated to close out the quarter, with the headline Consumer Price Index (CPI) rising 3.3% in March, reflecting a sharp increase in energy prices. Core CPI (excluding food and energy) remained more subdued at 2.6% year over year, while the Fed’s preferred inflation measure, the core Personal Consumption Expenditures (PCE) deflator, rose 3.0% year over year in February. The extent to which higher energy prices feed into core inflation is less clear and will depend on the duration of the Middle East conflict, but poses a greater risk given the downside to growth and the Fed’s limited capacity to respond.
Monetary Policy – The Fed paused its easing cycle in Q1, holding the federal funds rate at 3.50% to 3.75% in January and March Federal Open Market Committee (FOMC) meetings. Governors Waller and Miran dissented in January in favor of a 25 basis points (bps) cut, with Miran again dissenting in March. The Fed noted stable unemployment and uncertainty from Middle East developments, while continuing reserve management purchases (RMPs) of Treasury bills at about $40 billion per month, expected to taper to $20 to $25 billion per month beginning this summer.
The FOMC released its updated Summary of Economic Projections in March, which showed higher expected GDP growth, higher inflation in 2026-2027, and higher unemployment in 2027. Despite this, the “dot plot” remained unchanged, with the FOMC signaling one additional 25 bps cut in 2026 and 2027. The estimated longer-run neutral rate edged slightly higher from 3.0% to 3.125%. Markets currently expect the Fed to remain on hold in 2026 amid growing risks to inflation and growth.
Fiscal Policy – Fiscal policy remained expansionary during Q1, highlighted by increased government spending and continued implementation of the One Big Beautiful Bill Act (OBBBA). Among other things, the OBBBA provides fiscal stimulus through enhanced household tax refunds and favorable business expensing provisions designed to support consumer spending and business investment. In February, Congress passed the Consolidated Appropriations Act, providing funding for more than 95% of the federal government through the end of FY2026 (ends Sept 2026), locking in higher discretionary spending across defense, health, education, and infrastructure. Balancing out these efforts were increased tax revenues and tariff collections which provided an improvement in the budget deficit.
Looking ahead, we anticipate fiscal policy to be quiet as we approach the midterm elections in November as significant differences between the two political parties preclude meaningful legislation. Additionally, the Supreme Court’s ruling against the Administration’s use of the International Emergency Economic Powers Act (IEEPA) to implement tariffs adds near-term uncertainty over trade policy. The Administration quickly pivoted to other methods to implement tariffs, including a temporary 10% global import surcharge under Section 122 and launching more legally durable Section 301 investigations against several trading partners. These actions suggest average effective tariff rates will be little changed, but trade uncertainty remains given yet to be determined rates on individual countries and products. On the municipal front, the sector faces growing financial pressures from increased local funding needs, the exhaustion of federal pandemic aid, and economic uncertainties related to tariffs. Municipalities enter this period from a position of relative strength, however, as solid revenues and robust reserves provide the flexibility needed to navigate these headwinds.
Credit Markets – Financial markets were unsettled in March as traders grappled with geopolitical tensions and rising energy prices. Bond markets experienced heightened interest rate volatility and shifting expectations for Federal Reserve policy. Despite persistent uncertainty surrounding inflation and economic growth, credit fundamentals remained stable with no signs of meaningful deterioration. Investment-grade spreads did widen some from historical tights, but the move was modest. New issuance remained robust even through the volatility, underscoring the resilience of the investment-grade market and the dominance of structural demand.
Yield Curve Shift
|
U.S. Treasury Curve |
Yield Curve 12/31/2025 |
Yield Curve 3/31/2026 |
Change (bps) |
|---|---|---|---|
|
3 Month |
3.633% |
3.677% |
4.4 |
|
1 Year |
3.475% |
3.662% |
18.7
|
|
2 Year |
3.475% |
3.796% |
32.1 |
|
3 Year |
3.540% |
3.817% |
27.7 |
|
5 Year |
3.726% |
3.944% |
21.8 |
|
10 Year |
4.169% |
4.319% |
15.0 |
Duration Relative Performance
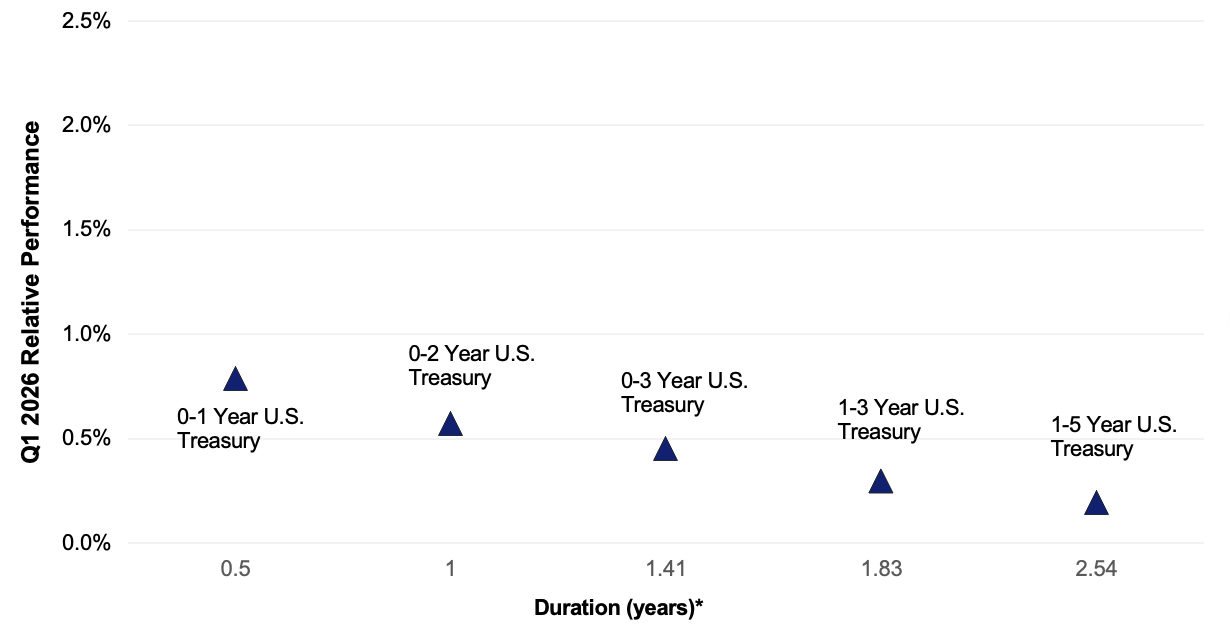
*Duration estimate is as of 3/31/2026
U.S. Treasury yields moved higher across the curve with the most pronounced increases occurring in the front and intermediate maturities. Against this backdrop, duration positioning was a meaningful driver of relative performance. Returns were tightly aligned with duration levels, with each incremental increase in effective duration corresponding with progressively lower returns. The roughly 60 bps performance gap between the 0-1 Year U.S. Treasury and the 1-5 Year U.S. Treasury is significantly wider than we have been accustomed to in recent quarters. Periods like this underscore that front-end yields can be the most sensitive to macro developments, and further, that Fed policy expectations remain fluid.
Credit Spread Changes
|
ICE BofA Index |
OAS* (bps) 12/31/2025 |
OAS* (bps) 3/31/2026 |
Change (bps) |
|---|---|---|---|
|
1-3 Year U.S. Agency Index |
1 |
-9 |
-10 |
|
1-3 Year AAA U.S. Corporate and Yankees |
7 |
2 |
-5 |
|
1-3 Year AA U.S. Corporate and Yankees |
25 |
29 |
4 |
|
1-3 Year A U.S. Corporate and Yankees |
44 |
54 |
10 |
|
1-3 Year BBB U.S. Corporate and Yankees |
71 |
84 |
13 |
|
0-3 Year AAA U.S. Fixed-Rate ABS |
50 |
47 |
-3 |
Credit spread movements in Q1 were somewhat mixed. Sectors such as Agencies, AAA Corporates, and AAA ABS tightened modestly reinforcing investors' preference for high quality credit. By contrast, lower-rated corporate segments experienced mild spread widening. Importantly, the magnitude of this move does not currently signal any broad deterioration in credit conditions. Investment grade corporate credit spreads remain near multi-year lows, and we continue to be constructive from a fundamental standpoint. Elevated all-in yields, particularly in the front end of the curve, helped to absorb higher new issue volumes.
Credit Sector Relative Performance of ICE BofA Indexes
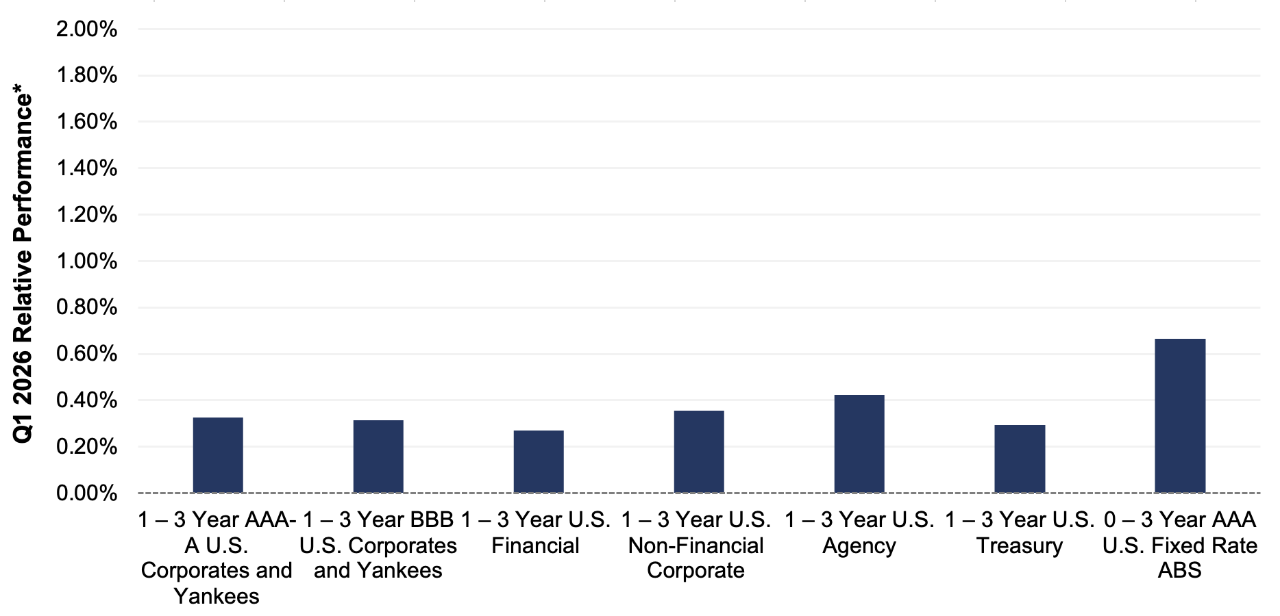
ICE BofA Index
AAA-A Corporate index outperformed the Treasury index by 3.3 bps.
AAA-A Corporate index outperformed the BBB Corporate index by 1.1 bps
U.S. Financials underperformed U.S. Non-Financials by 8.6 bps
Allocations to credit influenced returns at the margin, but were not nearly as dominant of a factor this quarter as duration. Broad credit portfolios slightly outperformed Treasuries; while at the industry level, financials lagged a bit. AAA fixed-rate ABS posted the highest returns; underscoring the sector’s defensive profile, attractive income, and limited duration exposure.
What were the major factors influencing money market funds this quarter?
The first quarter of 2026 saw the Federal Reserve pause its easing cycle, holding the federal funds target range steady at 3.50%–3.75%. Key economic indicators remain mixed and the Fed path forward remains unclear. Inflation continues to run above the Fed’s preferred targets, and the conflict in Iran has heightened concerns around additional inflationary pressures. In addition, labor market data has been uneven, with near-term trends still undefined.
While opinions vary regarding the timing and pace of future FOMC actions, market consensus currently reflects a holding pattern through the remainder of 2026. The primary challenge for managers will be assessing how geopolitical developments, economic conditions, inflation trends, and employment data ultimately influence the yield curve and the timing and direction of future Federal Reserve policy decisions Industry-wide, money market fund assets continued to trend higher during the quarter, as the product remained an attractive option relative to other short-term cash equivalent alternatives.
First American Prime Obligations Funds
Credit quality, trading conditions, and trading ranges remained stable in Q1 despite an uncertain interest rate, geopolitical, and economic environment. Considering the yield curve and a conservative cash flow framework, the First American Funds maintained strong portfolio liquidity metrics, influenced in part by shareholder composition. We continued to employ a heightened credit discipline, emphasizing investments with minimal credit and headline risk to Fund investors.
During the quarter, our primary investment objective was to prioritize liquidity while opportunistically enhancing portfolio yield through a combination of fixed- and floating-rate securities, consistent with our economic, credit, and interest rate outlook. We believe the current credit environment, coupled with higher relative fund yields, supports the sector as an appropriate short-term investment option.
First American Government and Treasury Funds
While the FOMC remains somewhat divided on the need and pace of future rate actions, the current administration appears supportive of lower rates. As a result, government money market funds maintained a defensive posture, positioning portfolios to preserve yields with expectations for flat to modestly lower federal funds rates over the next 12 months. Managers selectively extended portfolio duration by investing in longer-term securities when yields were flat to accretive to the overall portfolio. Current market conditions continue to support a barbell-style investment strategy. For money market fund investors, extending into longer-term securities has placed little, if any, downward pressure on portfolio yields. Additionally, a more normalized repo/SOFR rate environment has made short Treasury bills and GSE discount notes logical substitutes for repo, providing incremental yield opportunities. Strategically, when appropriate value was identified, managers added floating-rate investments expected to benefit shareholders over the securities’ holding periods. Going forward, investment strategy will remain focused on the pace and direction potential rate action as markets assess the Fed’s tolerance for inflation, labor market volatility, and economic growth, all of which will influence the timing and magnitude of future policy decisions.
First American Retail Tax Free Obligations Fund
Market conditions tightened meaningfully during the first quarter of 2026, driven by strong municipal technicals and elevated reinvestment demand. The SIFMA Municipal Swap Index fell approximately 100 bps in early January and remained at low levels for much of the quarter. Strong money market demand also flowed into the short municipal note markets, compressing yields across one-year maturities by as much as 30 basis points into February. The suppressed yields for tax-free money market securities were largely a byproduct of heavy reinvestment flows from municipal bond maturities and coupon payments, which provided strong, consistent demand for short-term tax exempt paper. This is a typical seasonal pattern for municipals; therefore, we approached the quarter with a bias toward longer WAMs and higher allocations to fixed-rate securities relative to our competitors. This positioning provided greater stability to the Fund’s overall yield than would otherwise have been the case.
What near-term considerations will affect fund management?
Prime fund yields should continue to benefit from modest spread widening relative to government securities amid ongoing market uncertainty and volatility. On the margin, this dynamic is expected to further increase the yield differential between Prime and Government portfolios. In addition, front-end corporate yields should remain supported by ample supply and modest term risk premiums.
In the coming quarters, we will continue to capitalize on economically attractive investment opportunities based on market outlooks and break-even analysis. We believe the Institutional and Retail Prime Obligations Funds should remain compelling short-term investment options for investors seeking enhanced yields on cash positions while assuming minimal incremental credit risk.
Yields within the government-sponsored enterprise (GSE) and Treasury sectors are expected to move in line with anticipated and realized Federal Reserve rate actions. Government and Treasury fund yields may decline modestly as higher-yielding securities mature out of portfolios. However, with the Fed on hold for the foreseeable future, duration extension opportunities should exist with minimal to no impact on overall portfolio yields.
With the conclusion of quantitative tightening, more normalized SOFR and repo levels, and occasional supply dislocations, managers can opportunistically purchase short Treasury bills and GSE discount notes as effective repo substitutes. Floating-rate securities will remain a core component of the overall investment strategy, contributing incremental yield, enhanced diversification, and price stability.
For more information about the portfolio holdings, please visit
https://www.firstamericanfunds.com/index/FundPerformance/PortfolioHoldings.html
Sources
Bloomberg
https://www.federalreserve.gov/monetarypolicy/files/monetary20260128a1.pdf
https://www.federalreserve.gov/monetarypolicy/files/monetary20260318a1.pdf
https://www.federalreserve.gov/monetarypolicy/files/fomcprojtabl20260318.pdf
https://www.newyorkfed.org//markets/opolicy/operating_policy_251210a
https://appropriations.house.gov/news/press-releases/signature-moment-fy26-appropriations-signed-law-president-trump
https://www.aau.edu/newsroom/leading-research-universities-report/congress-wraps-fy26-science-and-education-funding
https://www.bbc.com/news/articles/cn8146l0n55o

Jim Palmer, CFA

Jeff Plotnik

Mike Welle, CFA